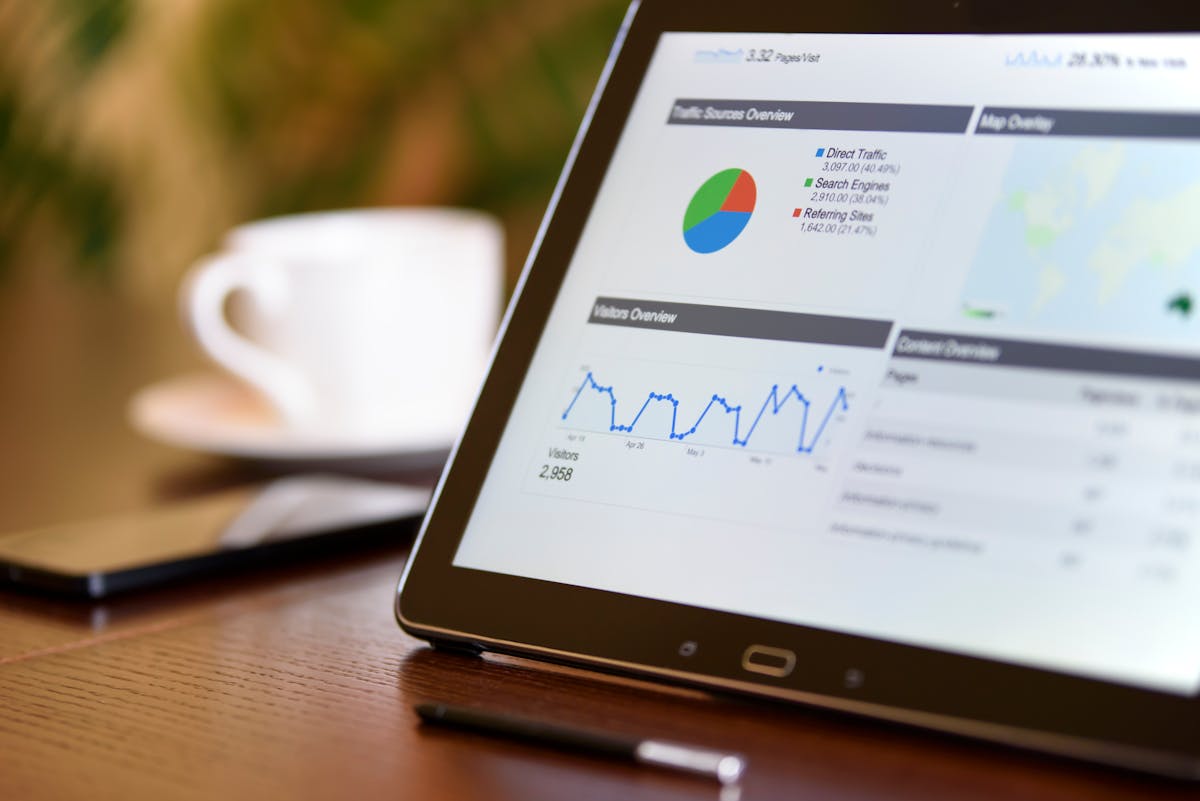
The BI Problem That 2026 Solves
Business intelligence has a dirty secret: most dashboards don't drive decisions. They display data. Someone still has to interpret it, decide what it means, and figure out what to do. A 2025 Tableau survey found that 61% of dashboard users say they "look at dashboards but still make decisions based on gut feeling."
2026 BI changes this by moving from "here's what happened" to "here's what's happening, why, and what you should do about it."
The 2026 BI Stack
Layer 1: Automated Data Integration (Foundation)
2024: Manual ETL pipelines, data engineers writing SQL
2026: AI-configured data pipelines, natural language data modeling

Instead of: "Write a SQL query to join customers with orders"
Now: "Connect customer data to order data, update daily"
Building something similar?
See how we approach business software development.
By 2026, 50% of new data integrations will be configured using natural language or AI-assisted tools (Gartner projection), reducing the technical barrier to BI.
Layer 2: Intelligent Analytics (Core)
Traditional BI answers: "What happened?"
2026 BI answers: "What happened, why did it happen, and what's likely to happen next?"
| Question Type | 2024 BI | 2026 BI |
|---|---|---|
| What happened? | Dashboards, reports | Same, but auto-generated |
| Why did it happen? | Manual analysis | AI-identified root causes |
| What will happen? | Not available | Predictive forecasting |
| What should we do? | Not available | AI-generated recommendations |
Layer 3: Decision Support (New in 2026)
This is the breakthrough layer. 2026 BI doesn't just show data — it recommends actions:
Example: Property Management BI in 2026

Alert: "Property A occupancy dropped 15% this quarter"

2024 BI: Shows the chart. You figure out why.
2026 BI: "Occupancy dropped because:
  - 3 units vacant >30 days (market rate misalignment detected)
  - 2 tenants gave notice (maintenance response time exceeded SLA)
  - Comparable properties averaged 97% occupancy (you're below market)

  Recommended actions (ranked by expected impact):
  1. Adjust Unit 4B rent to $1,850 (market rate) — Expected: fill in 2 weeks
  2. Add second maintenance technician — Expected: reduce response time by 40%
  3. Offer lease renewal incentives to at-risk tenants — Expected: retain 1.5 tenants

  Click to execute any recommendation."
Key Technologies Enabling 2026 BI
1. Natural Language Querying
Instead of: Building a dashboard with filters and drill-downs
User types: "Show me revenue by property for Q2, compared to Q1,
             and highlight any property that dropped more than 10%"
System: Generates the visualization instantly
Projected adoption: 45% of BI interactions will be natural language by 2026 (IDC).
2. Automated Insight Detection
The system continuously monitors data and proactively surfaces anomalies, trends, and opportunities — without being asked.
"Revenue from Property C is trending up 22% month-over-month.
 This is driven by a 40% increase in short-term leases.
 Consider converting 2 more units to short-term to capture this demand."
3. Embedded BI
BI moves from a separate tool to embedded in the workflows where decisions happen:
- In the property management system: "This tenant's payment history suggests elevated churn risk"
- In the scheduling system: "This time slot has 40% no-show rate — consider confirming appointments"
- In the inventory system: "This product's reorder point should be adjusted based on seasonal trend"
4. Collaborative BI
Decision-making moves from individual dashboards to shared insight spaces where teams can annotate, discuss, and track decisions:
[Revenue chart showing Q3 dip]
  Sarah (Sales): "This dip correlates with our price increase on Aug 1"
  Mike (Ops): "Confirmed — support tickets about pricing spiked the same week"
  Decision: "Roll back price increase for Product B, test 50% increase on Product C"
  Status: In Progress | Owner: Sarah | Due: Oct 15
What This Means for Your Business
If You Don't Have BI Yet
Don't start with 2026's most advanced capabilities. Build the foundation:
- 01Get your data in one place — Data integration is the prerequisite for everything
- 02Start with 3–5 KPI dashboards — Not 20 dashboards no one uses
- 03Establish measurement baselines — You need "before" data to show "after" value
- 04Choose tools that support AI integration — Ensure your 2025 choice can evolve to 2026
If You Have Existing Dashboards
Evolve toward 2026 capabilities:
| Current State | 2026 Upgrade |
|---|---|
| Static dashboards | Add natural language query layer |
| Manual analysis | Add automated insight detection |
| Separate BI tool | Embed insights into operational systems |
| Individual access | Add collaborative decision tracking |
| Historical only | Add predictive forecasting |
Cost Implications for 2026
| BI Approach | 2025 Cost | 2026 Cost | What's Different |
|---|---|---|---|
| Basic dashboards (Power BI, Looker) | $12K–$60K/yr | $10K–$50K/yr | Getting cheaper |
| Custom BI with AI insights | $40K–$100K/yr | $25K–$60K/yr | AI costs dropping |
| Embedded BI in operations | $50K–$150K build | $30K–$100K build | Component reuse |
| Full decision support system | $150K+ | $80K–$120K | Pre-built AI layers |
TIP
Key Takeaways
- 61% of dashboard users still make gut-based decisions — 2026 BI fixes this
- Three layers: automated integration → intelligent analytics → decision support
- 45% of BI interactions will be natural language by 2026
- Embedded BI puts insights where decisions happen, not in a separate tool
- Natural language querying is the highest-ROI 2026 capability to adopt first
- BI costs are dropping as AI commoditizes what used to require data scientists